The world of finance has always been a complex tapestry of data, trends, and strategies. At the heart of this intricate world lies technical analysis, a method that traders have relied upon for centuries to predict future price movements based on historical data. As the digital age dawned and brought with it the rise of cryptocurrencies, the applicability and significance of technical analysis have only grown. This section delves deep into the realm of technical analysis, its relevance in cryptocurrency trading, and how it stands as a beacon for traders navigating the volatile waters of digital currencies.
What is Technical Analysis?
Technical analysis is a trading discipline that seeks to forecast the future price movements of assets by studying past market data, primarily focusing on price and volume. Unlike its counterpart, fundamental analysis, which delves into the intrinsic value of an asset by examining related economic, financial, and other qualitative and quantitative factors, technical analysis is purely based on the historical performance of the market and price of a security.
| Criteria | Technical Analysis | Fundamental Analysis |
|---|---|---|
| Basis | Price movements, volume, and historical market data | Economic fundamentals, company performance, industry trends |
| Time Horizon | Short-term | Long-term |
| Data Sources | Price charts, trading volumes | Financial statements, industry data, economic indicators |
| Key Tools | Charts, technical indicators, patterns | Financial ratios, earnings reports, economic data |
Cryptocurrency: A New Frontier
Cryptocurrencies, decentralized digital assets that leverage blockchain technology to gain transparency and immutability, have revolutionized the financial landscape. Since the launch of Bitcoin in 2009, the crypto market has expanded exponentially, with thousands of digital currencies now in circulation. The decentralized nature of these currencies, coupled with their global accessibility, has made them both an exciting investment opportunity and a volatile trading asset.
For traders, the volatility of the cryptocurrency market presents both challenges and opportunities. Price swings can be dramatic, driven by factors ranging from regulatory news, technological advancements, market sentiment, to macroeconomic factors. This unpredictability makes the role of technical analysis even more crucial for traders aiming to capitalize on price movements and mitigate potential risks.
The Convergence of Traditional Techniques and New Age Assets
While cryptocurrencies represent a new frontier in trading, the principles of technical analysis remain steadfast. The patterns, trends, and indicators that traders have used for traditional assets are now being applied to the crypto market, with some modifications to account for its unique characteristics. As we delve deeper into this article, we’ll explore how these traditional techniques are being adapted for cryptocurrency trading, offering traders a blend of time-tested strategies and innovative approaches tailored for the digital age.
The Foundations of Technical Analysis
Delving into the world of technical analysis requires an understanding of its historical roots and the foundational principles that underpin this analytical method. From its early beginnings in the bustling financial markets of 17th century Amsterdam to its modern-day applications in the digital age, technical analysis has evolved, adapted, and remained a steadfast tool for traders across the globe.
A Glimpse into History
Technical analysis, as a formalized method, can trace its origins back to the 17th century, specifically in the financial markets of Amsterdam. One of the earliest recorded uses of this method was by Joseph de la Vega, a merchant, poet, and stock trader, in his writings about the Amsterdam stock exchange. However, it wasn’t until the late 19th and early 20th centuries that technical analysis began to take shape as a structured discipline, with pioneers like Charles Dow, co-founder of Dow Jones & Company, laying down some of the foundational theories.
Technical vs. Fundamental Analysis
While both technical and fundamental analysis aim to help traders make informed decisions, they differ significantly in their approach and focus. As previously mentioned, technical analysis is centered on studying past market data, such as price and volume, to forecast future price movements. In contrast, fundamental analysis delves deep into the intrinsic value of an asset, examining a myriad of factors like financial statements, industry trends, and broader economic indicators.
| Aspect | Technical Analysis | Fundamental Analysis |
|---|---|---|
| Primary Focus | Price movements and market trends | Intrinsic value of an asset |
| Data Source | Historical market data, charts | Company financials, industry reports, economic data |
| Timeframe | Typically short-term | Generally long-term |
| Tools & Techniques | Chart patterns, indicators, volume analysis | Earnings per share, price-to-earnings ratio, macroeconomic indicators |
Core Principles of Technical Analysis
At its core, technical analysis operates on a few foundational principles:
- Market Action Discounts Everything: All known, unknown, and future information is reflected in the price. This means that factors like news events, earnings reports, and even natural disasters are already factored into the asset’s current price.
- Prices Move in Trends: Technical analysts believe that prices often move in discernible short-term, medium-term, and long-term trends. Recognizing these trends early is key to successful trading.
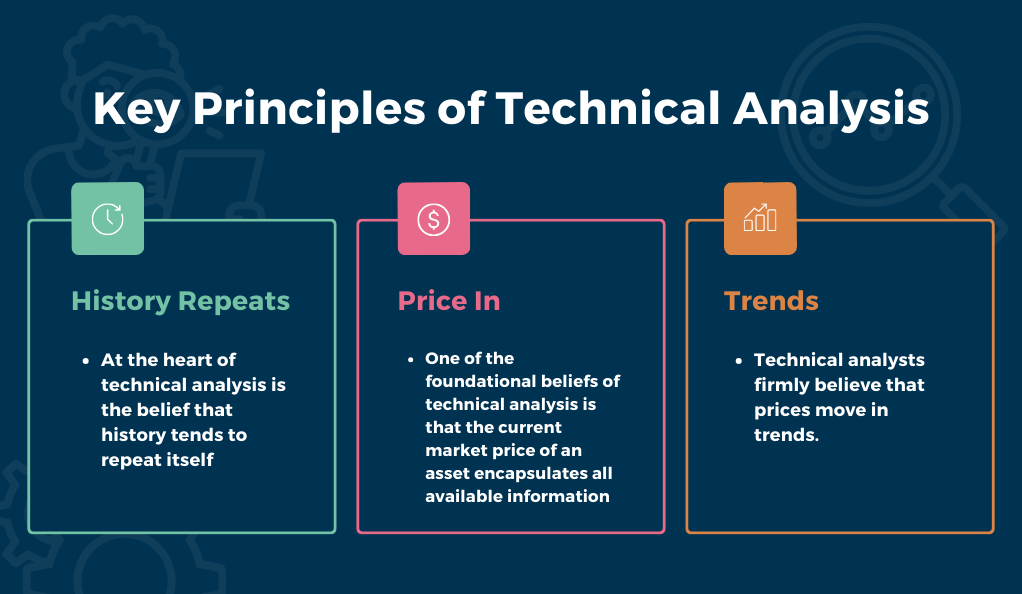
- History Tends to Repeat Itself: Due to the repetitive nature of market participants and the way they react to global economic variables, historical price movements can often indicate future price movements.
Key Principles of Technical Analysis
Technical analysis, while rooted in historical data and patterns, is driven by a set of core principles that guide traders in their decision-making processes. These principles, honed over centuries and tested across various market conditions, provide a framework for understanding market behaviors and predicting future price movements.
Market Prices Reflect All Relevant Information
One of the foundational beliefs of technical analysis is that the current market price of an asset encapsulates all available information. This includes not only public data, such as financial reports and news releases, but also insider information and market sentiment. As new information becomes available, it is immediately factored into the price, making the market highly efficient in this regard.
Factors Influencing Market Prices:
- Public Information:
- Earnings reports
- News releases
- Economic indicators
- Private/Insider Information:
- Mergers and acquisitions
- Internal financial data
- Psychological/Sentimental Factors:
- Investor sentiment
- Market speculation
- Fear and greed
Price Movements are Not Random; They Follow Trends
Technical analysts firmly believe that prices move in trends. These trends can be upward (bullish), downward (bearish), or sideways (neutral). The key is to identify these trends early on, allowing traders to make informed decisions about buying, selling, or holding an asset. There are various tools and techniques, such as moving averages and trendlines, that analysts use to detect and confirm these trends.
Types of Market Trends:
- Bullish (Upward) Trend:
- Characterized by higher highs and higher lows, indicating rising prices.
- Bearish (Downward) Trend:
- Defined by lower highs and lower lows, signaling falling prices.
- Neutral (Sideways) Trend:
- Prices move within a horizontal range, indicating market indecision.
History Repeats Itself
At the heart of technical analysis is the belief that history tends to repeat itself. This repetition is attributed to the consistent nature of market psychology and the collective behavior of market participants. Patterns that have manifested in the past are likely to recur in the future, making historical data invaluable in predicting future price movements. Chart patterns, such as head and shoulders, double tops, and triangles, are manifestations of this principle, as they have been observed to repeat over time across different assets and market conditions.
Common Chart Patterns and Their Implications:
- Head and Shoulders:
- Often signals a reversal in the current trend.
- Double Top:
- Indicates potential bearish reversal after an upward trend.
- Double Bottom:
- Suggests potential bullish reversal after a downward trend.
- Triangles (Ascending, Descending, Symmetrical):
- Indicates periods of consolidation and potential breakout direction.
Tools and Techniques in Technical Analysis
Technical analysis, while rooted in its foundational principles, is brought to life through a myriad of tools and techniques that traders employ to dissect market data. These tools, ranging from simple chart patterns to complex mathematical indicators, provide actionable insights into potential market movements, allowing traders to strategize effectively.
Chart Patterns
Chart patterns are formations created by the price movements of an asset on a chart. Recognizing these patterns can provide insights into potential future price movements.
Popular Chart Patterns and Their Interpretations:
- Cup and Handle:
- A bullish continuation pattern that resembles the shape of a tea cup.
- Indicates potential for a bullish breakout.
- Flag and Pennant:
- Short-term continuation patterns that mark a consolidation before the previous move resumes.
- Flags indicate a slight slope against the prevailing trend, while pennants are small symmetrical triangles that begin wide and converge.
- Wedges:
- Can be rising or falling, indicating reversals or continuation based on the prevailing trend and the direction of the wedge.
- Rising wedges often result in bearish reversals, while falling wedges typically indicate bullish reversals.
Technical Indicators
Technical indicators are mathematical calculations based on historical price, volume, or open interest information that aim to forecast future price changes.
Common Technical Indicators and Their Uses:
- Moving Averages (MA):
- Averages out price data to create a single flowing line, making it easier to identify the direction of the trend.
- Used to confirm trends and signal potential buy or sell opportunities.
- Relative Strength Index (RSI):
- Measures the speed and change of price movements, oscillating between zero and 100.
- Typically, an RSI above 70 indicates an overbought condition, while below 30 signifies an oversold condition.
- Moving Average Convergence Divergence (MACD):
- Tracks differences between two moving averages.
- Signal line crossovers, overbought/oversold conditions, and divergences are used to spot potential trend changes.
Volume and Open Interest
Volume represents the number of shares or contracts traded in an asset or an entire market during a given period. Open interest, on the other hand, is the total number of outstanding derivative contracts, such as options or futures, that have not been settled.
- Volume: Can confirm the strength of a trend. An increase in volume indicates strong interest, while low volume may point to a lack of interest or a potential reversal.
- Open Interest: In the futures market, rising open interest alongside rising prices is a bullish indicator, suggesting that new money is coming into the market.
Support and Resistance
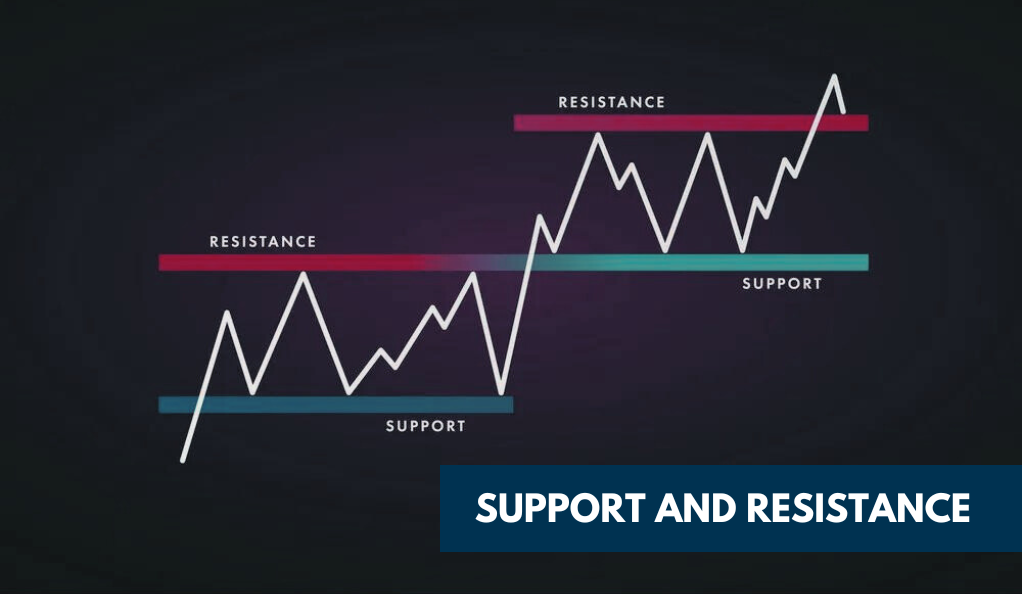
Support is a price level where a downtrend can be expected to pause due to a concentration of demand. Resistance is a price level where a trend can pause or reverse due to a concentration of supply.
- Support: Represents areas of buying interest. When prices drop to a support level and then begin to bounce back up, it’s a sign that the support level is holding.
- Resistance: Represents areas of selling interest. When prices rise to a resistance level and start to pull back down, it indicates that the resistance level is being respected.
Technical Analysis in Cryptocurrency Trading
The cryptocurrency market, with its decentralized nature and global reach, presents a unique set of challenges and opportunities for traders. As this digital asset class continues to mature, the role of technical analysis in navigating its volatile waters has become increasingly prominent. In this section, we’ll explore the nuances of applying technical analysis to cryptocurrency trading and delve into some successful strategies that have emerged in this space.
The Unique Landscape of Cryptocurrency Markets
Cryptocurrencies differ from traditional assets in several key ways:
- Decentralization: Unlike traditional currencies or stocks, cryptocurrencies operate on decentralized platforms.
- Volatility: Cryptocurrencies are known for their price volatility, with prices capable of making significant moves within short timeframes.
- 24/7 Trading: Unlike stock markets, which have specific trading hours, cryptocurrency markets operate 24/7.
Adapting Technical Analysis for Cryptocurrencies
The foundational principles of technical analysis are consistent across markets, but the cryptocurrency sector demands specific adaptations. Due to the crypto market’s rapid price fluctuations, traders often use shorter chart timeframes to capture relevant data. Volume analysis is vital, as significant volume spikes, often from institutional investors or “whales,” can drastically affect prices. Traditional indicators, developed for stocks and forex, might require modifications for cryptocurrencies, ensuring technical analysis stays pertinent in this dynamic digital asset landscape.
Successful Technical Analysis Strategies in Crypto Trading

Several technical analysis strategies have proven effective in the cryptocurrency market:
- Trend Following: Given the strong trend nature of cryptocurrencies, strategies like moving average crossovers can be effective.
- Momentum Trading: Using indicators like the RSI or MACD to gauge momentum and enter or exit trades.
- Breakout Trading: Given the crypto market’s propensity for strong breakouts, identifying key resistance or support levels and trading based on their breach can be profitable.
Case Studies
Bitcoin’s 2017 Bull Run: In 2017, Bitcoin experienced a significant bull run. Technical analysts observed a series of higher highs and higher lows, a classic bullish trend. The MACD and RSI both confirmed the strong upward momentum. Traders who recognized these signs and employed trend-following strategies would have been positioned to capitalize on this move.
Ethereum’s Consolidation in 2020: Ethereum, another major cryptocurrency, showed a prolonged consolidation phase in mid-2020. Technical analysts observed a symmetrical triangle pattern, indicative of a market in consolidation. A breakout strategy would have been ideal here, with traders entering positions as Ethereum broke out of this pattern.
Criticisms and Controversies
Like any analytical method, technical analysis is not without its detractors. Over the years, various criticisms have been leveled against it, questioning its efficacy and reliability. In this section, we’ll explore some of the primary criticisms of technical analysis, especially in the context of cryptocurrency trading, and delve into the controversies that surround it.
The Efficient-Market Hypothesis (EMH)
One of the most significant criticisms of technical analysis stems from the Efficient-Market Hypothesis. This theory posits that at any given time, asset prices fully reflect all available information, making it impossible to consistently achieve returns that outperform average market benchmarks.
Forms of the Efficient-Market Hypothesis:
- Weak Form:
- Asserts that stock prices already reflect all past publicly available information.
- Semi-Strong Form:
- Claims that stock prices instantly change to reflect new public information.
- Strong Form:
- Believes that stock prices instantly reflect even hidden or “insider” information.
Under the weak form of EMH, which claims that stock prices already reflect all past publicly available information, technical analysis would be rendered moot, as it primarily relies on historical data.
The Random Walk Hypothesis
Closely related to the EMH is the Random Walk Hypothesis, which suggests that stock market prices evolve according to a random walk and thus cannot be predicted. If this hypothesis holds true, then using past price movements to predict future price movements, as technical analysis does, would be futile.
Overemphasis on Patterns
Critics argue that technical analysts sometimes overemphasize certain patterns, leading to self-fulfilling prophecies. For instance, if a significant number of traders believe a specific pattern predicts a bullish future, they might buy in anticipation, causing the asset’s price to rise.
Subjectivity and Bias
While technical analysis offers various tools and indicators, their interpretation can be subjective. Two analysts looking at the same chart might draw different conclusions based on their biases, experiences, or beliefs.
Cryptocurrency-Specific Criticisms
Given the relatively young age of the cryptocurrency market and its inherent volatility:
- Lack of Historical Data: Unlike traditional assets with decades or even centuries of data, many cryptocurrencies have limited historical data, which can make certain technical analysis tools less reliable.
- Influence of Whales: Large holders, often referred to as “whales,” can significantly influence cryptocurrency prices, leading to sudden and unpredictable market movements.
Counterarguments and Defense
While technical analysis faces its share of criticisms, many traders and analysts ardently defend its merits. They often point to the empirical success of numerous traders who have consistently benefited from using technical analysis, suggesting that it can indeed be a valuable tool when applied correctly. Moreover, many seasoned analysts advocate for a hybrid approach, combining both technical and fundamental analysis. This combination offers a more comprehensive perspective: while technical analysis identifies potential trading opportunities, fundamental analysis provides a broader understanding of the market’s overall context. This balanced approach underscores the continued relevance and efficacy of technical analysis in the ever-evolving world of trading.
The Future of Technical Analysis in Crypto Trading
The realm of cryptocurrency is ever-evolving, driven by technological advancements, regulatory changes, and shifts in market dynamics. As this landscape transforms, so too does the role and application of technical analysis. In this concluding section, we’ll gaze into the future, exploring the potential trajectories of technical analysis in the world of cryptocurrency trading.
Integration of Artificial Intelligence (AI) and Machine Learning
With the rapid advancements in AI and machine learning, these technologies are poised to revolutionize technical analysis:
- Automated Pattern Recognition: AI can be trained to recognize and act upon complex chart patterns faster and more accurately than human traders.
- Predictive Analytics: Machine learning algorithms can analyze vast amounts of data to predict potential market movements, refining their predictions over time through continuous learning.
Enhanced Visualization Tools
With technological advancements, market data visualization tools are evolving rapidly. The integration of Virtual Reality (VR) and Augmented Reality (AR) promises immersive trading experiences, allowing for more intuitive data interpretation. Additionally, dynamic dashboards that merge real-time updates with diverse data sources, like news and social sentiment, will offer traders a consolidated and efficient view of the market.
Evolution of Indicators and Tools
As the cryptocurrency market matures, experts may refine existing technical indicators and develop new ones to cater specifically to the nuances of digital assets.
Integration with Fundamental and Sentiment Analysis
The future might see a more holistic approach to analysis:
- Hybrid Models: Combining technical, fundamental, and sentiment analysis can provide a more rounded view of potential market movements.
- Real-time Sentiment Analysis: With the proliferation of crypto-related discussions on social media and forums, real-time sentiment analysis tools can offer immediate insights into market sentiment, complementing traditional technical analysis.
Challenges and Considerations
As the future of technical analysis unfolds, several challenges and considerations come to the forefront. One of the primary concerns is data privacy and security. As analytical tools become increasingly interconnected and reliant on extensive datasets, safeguarding user data becomes paramount. Additionally, while automation promises to streamline and enhance trading processes, there’s a risk of over-reliance. Depending too heavily on automated systems might lead to missed opportunities or even misinterpretations of market nuances. For traders and analysts, continuous education and staying updated with technological advancements are essential. The trading landscape is ever-evolving, and flexibility becomes a crucial trait. Adapting strategies and tools to the changing market dynamics will be a key determinant of success.
Continuous Education and Adaptation
The only constant in the world of cryptocurrency is change. For traders and analysts:
- Staying Updated: Continuous education and staying abreast of technological advancements will be crucial.
- Flexibility: Being adaptable and willing to evolve one’s strategies and tools will be a key determinant of success.
Conclusion
Technical analysis, with its rich history and foundational principles, has proven to be an invaluable tool for traders navigating the complex waters of financial markets, and more recently, the volatile realm of cryptocurrencies. Its techniques, ranging from chart patterns to intricate mathematical indicators, provide a structured approach to understanding and predicting market movements. As the world of cryptocurrency continues to evolve, so too will the methods and tools of technical analysis. The integration of advanced technologies like AI and machine learning, coupled with the continuous adaptation and education of traders, promises a future where technical analysis remains at the forefront of informed trading decisions, guiding individuals through the ever-changing landscape of digital assets.
At axerunners.com, our goal is to furnish well-rounded and trustworthy information regarding cryptocurrency, finance, trading, and stocks. Nonetheless, we avoid providing financial advice and instead encourage users to conduct their own research and meticulous verification.
Read More